2022 Test Data – HCS
Numbers and data are concrete symbols that are unable to be changed or manipulated once they have been produced. Everyone has undoubtedly heard the common saying “Numbers never lie”, but that declaration is extremely misleading. While numbers don’t necessarily change once the data is produced, the context around those numbers can paint an entirely different picture than the numbers themselves. Corporations use numbers to tell stockholders a certain story. Politicians use numbers to build their base. Professional sports teams constantly use numbers to make sure their fans have the most positive view possible of their favorite team. Technically numbers don’t lie, but they very much can be manipulated.
School achievement data based on standardized tests is dense, and the task of scouring concentrated percentiles can be laborious. Oftentimes, the general public wants something that is easily digestible when it comes to school district performance and test data. While the state will release district rankings, oftentimes there is little to no context for the ranking other than achievement and growth percentiles of grade levels, schools, and districts.
In Haywood County Schools, we understand that learning is not simply reflected in a percentile or data point or ranking. Our students are assessed in various ways throughout the school year to measure benchmarks for grade levels and schools as a whole, as well as gauge individualized student progress points along the way. It is our mission in HCS to know every student by name, strength, and need. Collecting and analyzing data is part of that mission.
During the school year, our students are measured using the AimsWeb assessment in the fall, winter, and spring in the subjects of Reading and Math. They are also measured by the IReady assessment which is given three times a year, as well. By assessing students at various intervals during the school year, teachers can see progress, but, more importantly, target specific areas of needed improvement for individual students. Data is used, not as a measuring tool, but as an informative piece of evidence that allows teachers to teach in the most effective and efficient ways possible. Along with accruing valuable data points by using these particular assessments, each assessment measures different learning goals for students.
The AimsWeb assessments in Reading and Math measure basic skills in each subject. Basic skills include reading comprehension and fluency and making calculations of measurements, sizes, and amounts. AimsWeb is an assessment that is used to monitor progress and ensure the majority of our students at each grade level are working toward basic grade level skills in each subject.
The IReady assessment measures student progress in relation to state academic standards and is given in grades K-8. This assessment is not always reflective of the basic skills of students in Reading and Math, but shows how well students understand the standards being taught. State standards are created in order to push the students to think at a deeper level beyond the basic skill levels of a subject. These tests combine test taking skills with in-depth knowledge of each subject. This assessment is more closely aligned with the year-end TNReady standardized tests given each spring.
TNReady tests also do not measure basic skills, but rather measure how well a student understands the state standard being taught throughout the year.
Over the next two weeks, HCS will be sharing all of our data – from AimsWeb to our TNReady test data. We’ll show each grade level’s growth during the year on AimsWeb and IReady. We’ll show the overall achievement percentages in each grade level on our TNReady assessments – the good and the bad. Above all else, we want to be as authentic as possible and celebrate our wins as well as acknowledge our areas for needed improvement. This will not be a smoke and mirrors operation; this will be clear and concise communication regarding the learning taking place in our district as well as areas where we need improvement.
The first set of data presented is our AimsWeb data for the entire district. AimsWeb is given to students in HCS from Kindergarten to the Tenth Grade in both Reading and Math and measures basic skill sets in each subject. Overall, our district showed tremendous growth throughout the year in both subjects. Below is a chart showing the progress from fall to spring on our AimsWeb assessments followed by a brief synopsis of the data as well as a description of the chart.
HCS AimsWeb Data – Reading
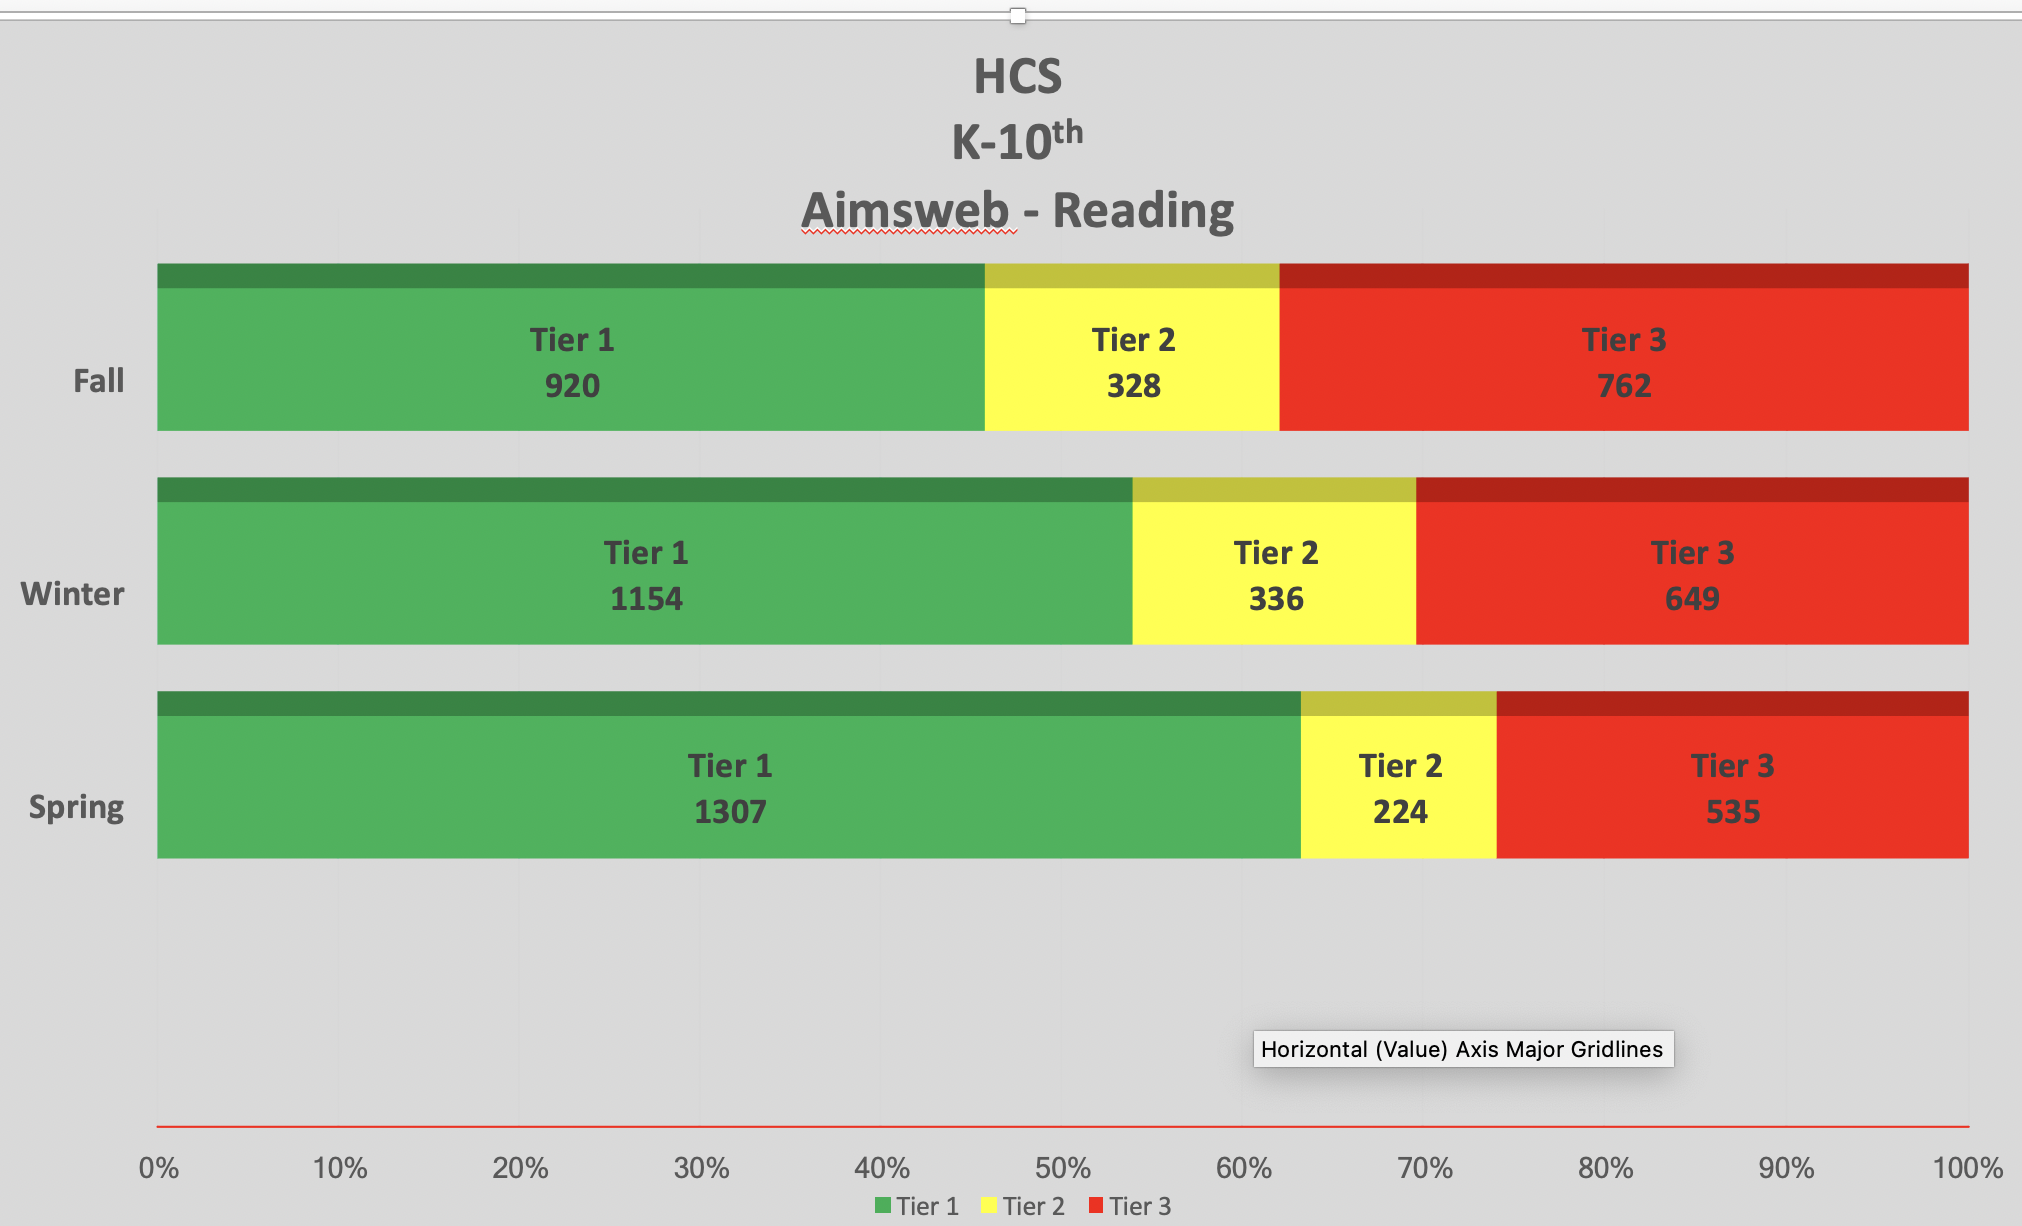
AimsWeb uses a three tiered system to measure student progress and provide information regarding where students are on their learning paths. While we want all students to be in Tier 1, a more realistic goal (especially coming on the heels of two fractured years of in-person learning) is to see substantial growth in our collective group of Tier 1 students. The tiers are described below:
Tier 1 = Low Risk (about 75%–95% of students in this group will meet the target): Students are on track to meet the end-of-year target and are least likely to need intervention. These students should continue to receive the general instructional program. Typically, the majority of students fall into this category.
Tier 2 = Moderate Risk (about 25%–65% of students in this group will not meet the target): Students are not on track and have a moderate risk of not meeting the end-of-year target. These students require some type of intervention, often taking the form of supplemental small group instruction.
Tier 3 = High Risk (about 50%–90% of students in this group will not meet the target): Students are not on track and are typically well-below grade level. These students have a high risk of not meeting the end-of-year target without intensive, individualized instructional intervention.
At the beginning of the year, around 48% of K-10 students in HCS were in Tier 1 in Reading. By the end of the year, that percentage had grown to 65%.
Nearly 20% of our students moved from either Tier 2 or Tier 3 to Tier 1.
A total of 227 students moved out of Tier 3 into either Tier 2 or Tier 1. Those students improved their reading to a level that no longer required intensive intervention and moved closer to being on grade level in fluency and comprehension.
By the end of the year in HCS, nearly 75% of our students were on grade level or approaching grade level in reading while possibly needing some small group, supplemental instruction.
Overall, our students in HCS showed tremendous growth on the AimsWeb benchmark assessments. We acknowledge that 25% of our students remaining in Tier 3 is far too many and will continue to use the intervention programs in place to help students improve their reading ability.
HCS AimsWeb Data – Math
Our Tier 1 students nearly doubled from the fall benchmark test to the spring benchmark test. By the time the year ended, nearly 65% of our students in HCS showed grade level skills in Math. The percentage was only 35% at the beginning of the year.
Our Tier 3 students made up nearly half of our total students at the beginning of the year, but that number shrank by nearly 400 students. In the fall, nearly 50% of our students needed intensive math intervention, but by the end of the year only 25% of our students needed intensive intervention.
While our reading gains were significant, our math gains were arguably more impressive.
By the end of the year, nearly 80% of our students were on grade level in math or needed minimal, supplemental intervention.
While we are nowhere near where we want to be, we are proud of the progress made in HCS.
HCS IReady Data – Reading
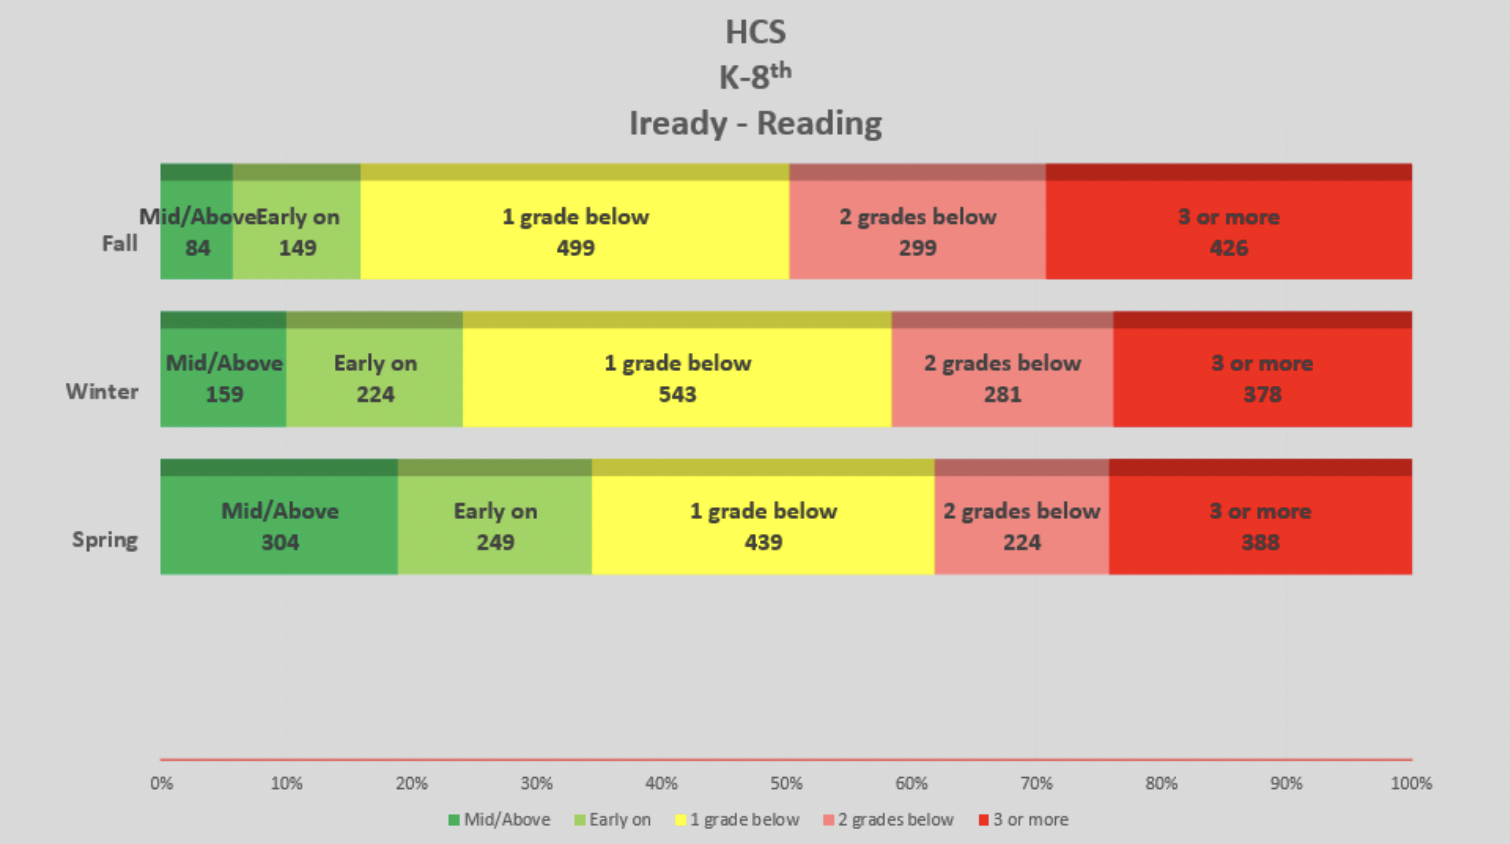
IReady data is broken down into five sub-groups:
- Mid/Above grade level: this group is made up of students who are proficient or mastering the grade level educational standards being taught.
- Early on grade level: this group is made up of students who are on track to mastery or proficiency of the grade level subject being taught.
- 1 grade below: this group of students is one grade behind their current grade level as it pertains to the standard being taught.
- 2 grades below: this group of students is two grades behind their current grade level as it pertains to the standard being taught.
- 3 grades below: this group of students is three grades or more behind their current grade level as it pertains to the standard being taught.
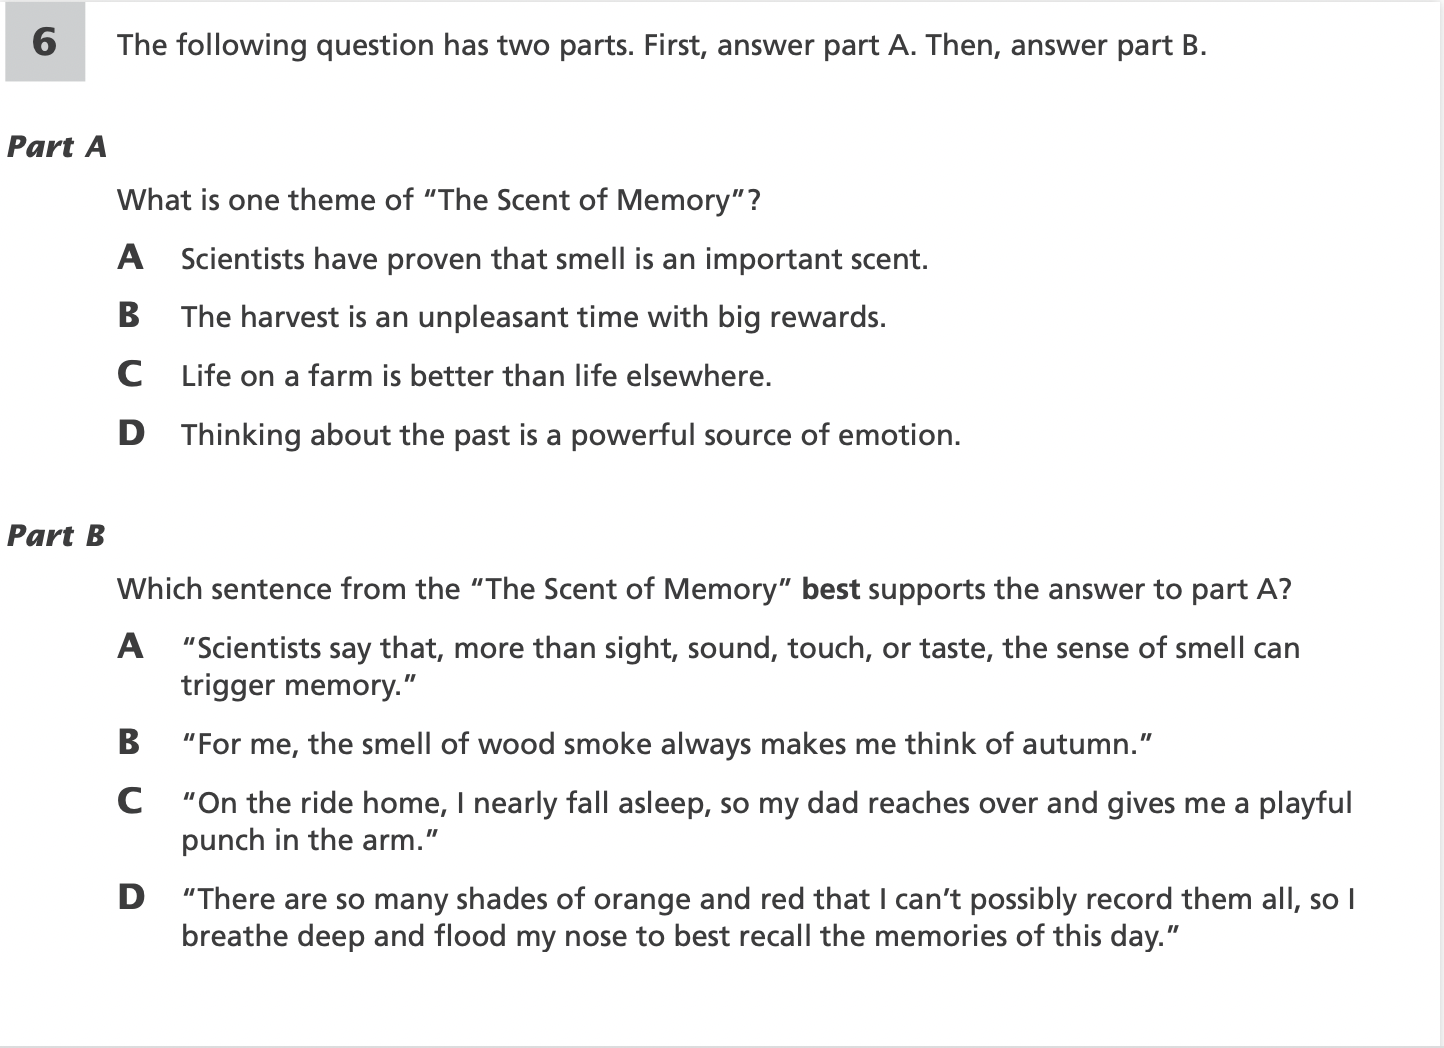
A sample TN State Standard in 6th grade English/Language Arts reads as follows:
6.RL.CS.5 Analyze how a particular sentence, chapter, scene, or stanza fits into the overall structure of a text and contributes to the development of the theme, setting, or plot.
As evidenced by the wording of the standard, mastery and proficiency of a certain standard goes well beyond simply being able comprehend a given text or identify a certain literary element such as theme or setting. It requires students to prove how certain aspects of a text fit into the overall literary element by choosing the correct answer out of four possible answers. This format is also used on the TNReady tests.
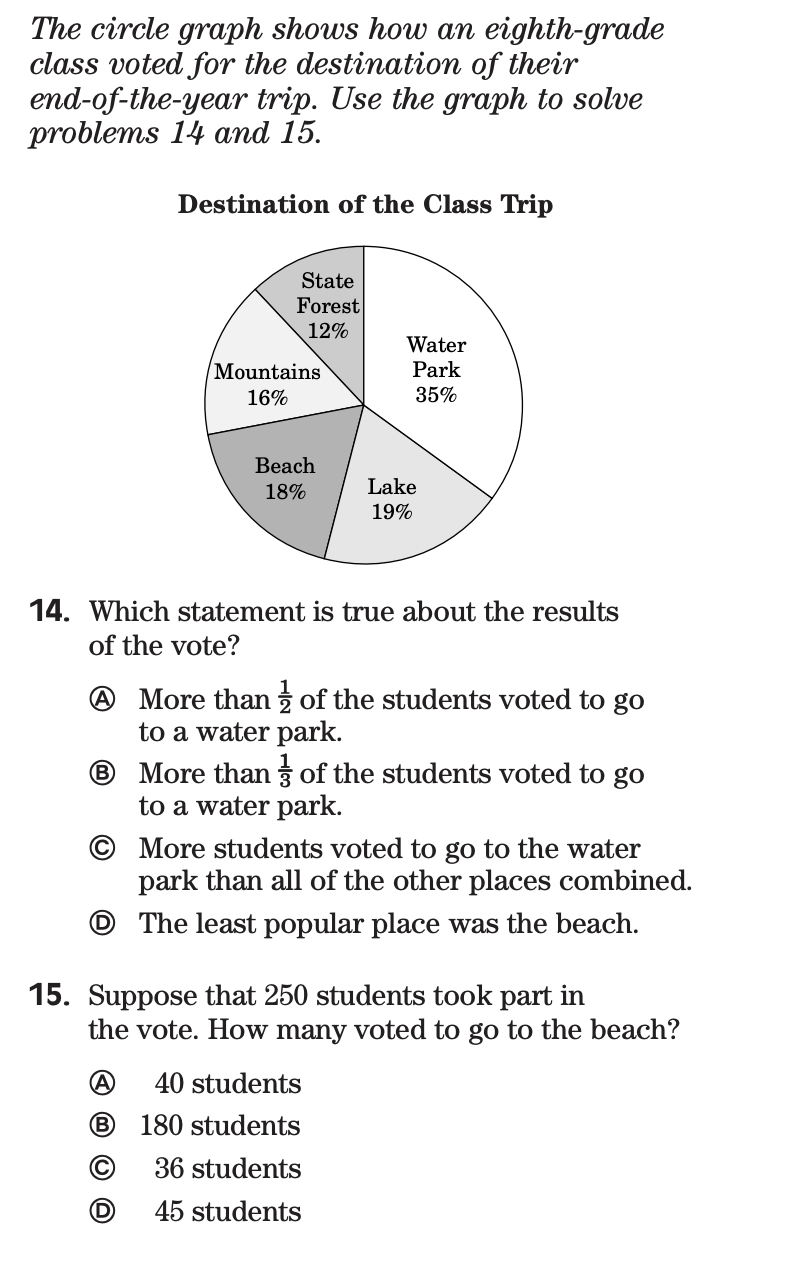
A sample question and passage from an IReady assessment is below:
Students in HCS also showed considerable gains on the IReady assessment throughout the course of the year, though the overall proficiency was lower on IReady than on AimsWeb. This is a common occurrence on tests that measure standard mastery (IReady and TNReady) when compared against tests that measure basic skills (AimsWeb).
At the beginning of the year, only 18% of students in HCS were mastering or showing proficiency in grade level standards in English/Language Arts. By the end of year, that percentage had doubled and increased to 36%. While we acknowledge that a 36% success rate has a lot of room for improvement, we also want to celebrate the impressive gains made by our students and teachers throughout the course of the year. Learning is clearly taking place across every campus in Haywood County Schools.
We also want to recognize that we did not close the gap nearly enough on our students who were three or more grade levels behind in ELA. Those students have been identified and will be provided with extra support in order to create the most amount of potential success possible for them.
HCS IReady Data – Math
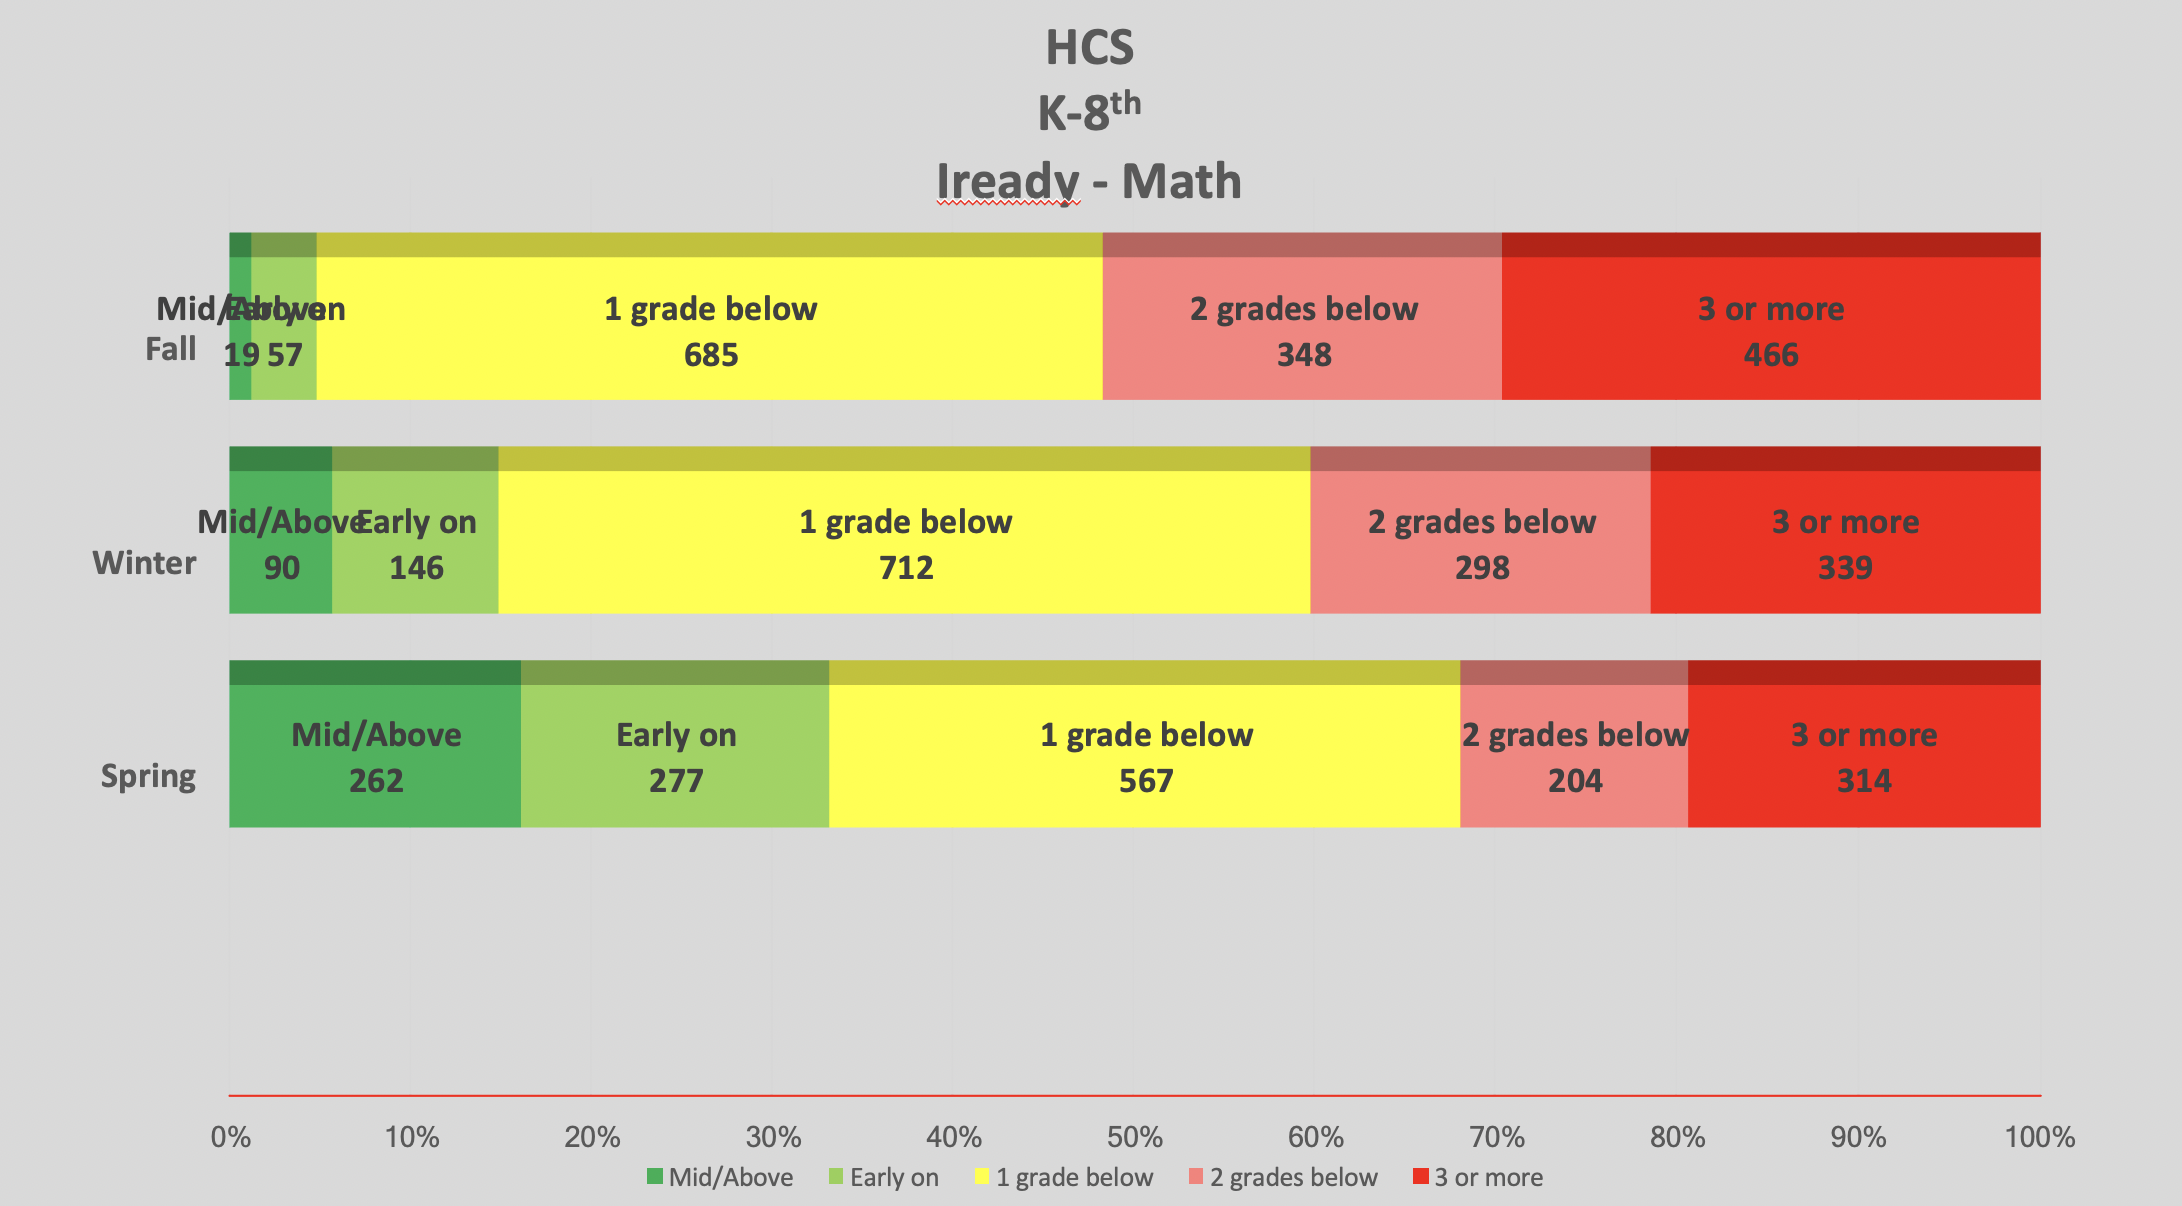
IReady data is broken down into five sub-groups:
- Mid/Above grade level: this group is made up of students who are proficient or mastering the grade level educational standards being taught.
- Early on grade level: this group is made up of students who are on track to mastery or proficiency of the grade level subject being taught.
- 1 grade below: this group of students is one grade behind their current grade level as it pertains to the standard being taught.
- 2 grades below: this group of students is two grades behind their current grade level as it pertains to the standard being taught.
- 3 grades below: this group of students is three grades or more behind their current grade level as it pertains to the standard being taught.
A sample IReady question for 8th grade Math is below:
Much like the ELA version of IReady and TNReady, the Math assessment of IReady goes beyond simply measuring basic skills of students. The questions ask the students to go in-depth on their knowledge of a standard rather than simply performing mathematical operations.
HCS students showed tremendous growth over the course of the year in their mastery and proficiency in Math. On the first IReady assessment in the fall, only 6% of K-8 HCS students were on or above their respective grade level in Math. By the end of the year, nearly 35% of K-8 students in HCS were on or above grade level in Math. The percentage of students on or above grade level in Math grew five times more than where they started. This is a win worth celebrating!
Our number of math students who were two grades or more below grade level decreased from 814 at the beginning of the year to 518 by the end.
Nearly 300 students moved closer to being on grade level throughout the course of the school year.
Over 500 students being two grades or more below grade level is unacceptable, however the growth of that subgroup throughout the year was impressive. Our work will continue to focus on the 500 students who find themselves behind grade levels in order to set them up for future success in their educational journey and beyond.
HCS TNReady Data – English/Language Arts
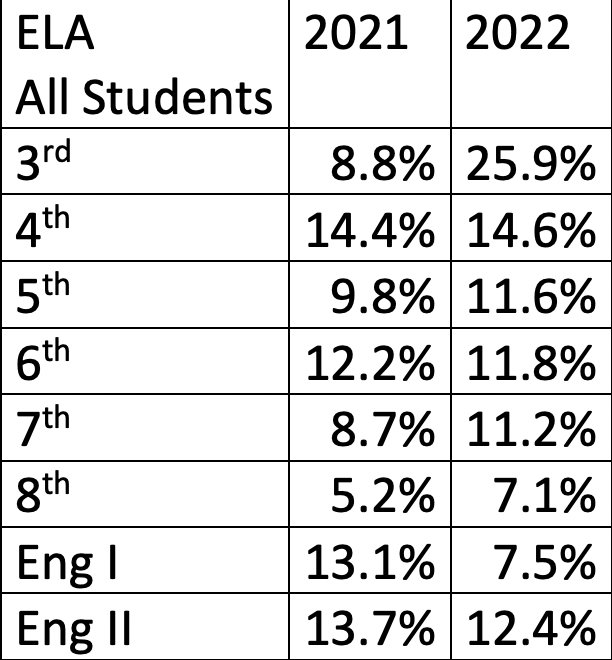
The percentages shown in this chart track student proficiency on the TNReady state standardized test given each Spring to measure student mastery of state standards. The percentages in the left column are from 2021; the percentages in the right column are from 2022. Five out of eight grade levels showed improvement from the previous year with third grade showing the most improvement and also outpacing the average gains made across the state of Tennessee in third grade. While this chart measures grade level growth from year to year, a better way of looking at student performance is by viewing the data from cohort to cohort.
For example, the third grade cohort in 2021 had an 8.8% proficiency rate. Those same students, however, had a 14.6% proficiency rate this past year in fourth grade. They nearly doubled their proficiency level in one year!
When looking at our cohorts there are some areas of concern. Only three cohorts showed substantial gains from last year to this year according to their results on TNReady, and two cohorts showed a two percent or more loss in proficiency from last year to this year. We also understand that the TNReady standardized ELA test is given on one day out of a 180 day school year, and there are many variables involved in that test taking process. We will use that data much like we use ALL of our data we collect – to focus on the best ways to prepare our students for future success.
For the most part, there was grade level to grade level improvement across the district, and we are very encouraged by that growth.
HCS TNReady Data – Math
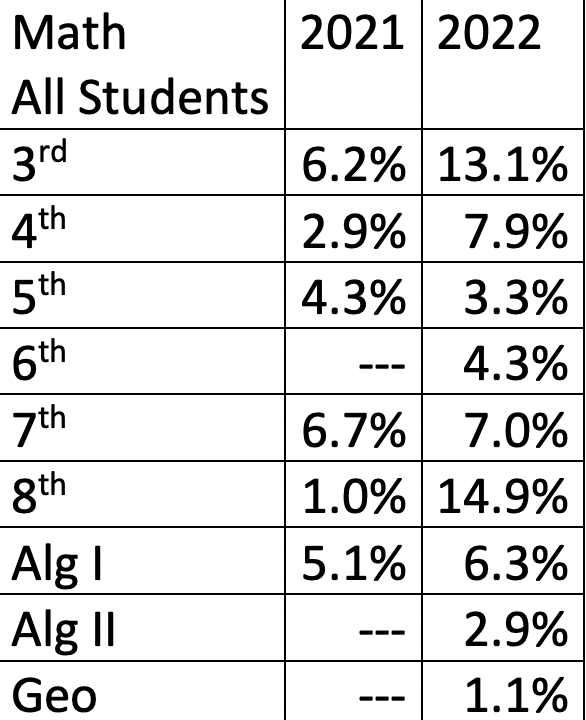
The percentages shown in this chart track student proficiency on the TNReady state standardized test given each Spring to measure student mastery of state standards. The percentages in the left column are from 2021; the percentages in the right column are from 2022. Seven out of eight grade levels showed improvement from 2021 to 2022. The columns that do not contain a percentage designate that there were no students who were proficient in HCS on that particular test in that particular year. Our overall proficiency percentages are low, but our gains in Math on TNReady were substantial.
Third and fourth grade levels more than doubled their proficiency percentage from the previous year.
Our 8th grade students increased grade level proficiency from 1% in 2021 to nearly 15% in 2022! On top of that, Every cohort of students showed gains in math from 2021 to 2022.
Students who just completed the 7th grade had a 7% proficiency rate, but the year prior had no students who were proficient. Our 8th grade students who were in 7th grade in 2021 doubled their proficiency percentage over the course of a year.
While our proficiency percentages are low overall, the gains that were made in Math were quite impressive over the course of a school year. The work that is being done is effective and is preparing our students for future success. The job is also arduous and takes time, but the gains being made are substantial.
Over the course of the next two weeks, each school’s data will be released in a similar format as the data shown in this piece. Each school showed tremendous growth throughout the year on the AimsWeb and IReady assessments. We will also release snapshots of highlights from individual grade levels in the district.
In the end, our district is about educating students, and students are much more than a number. The programs in place in HCS are preparing our students for the most opportunities possible for future success, and those opportunities stretch well beyond a chart or percentile. Our students are learning and making up valuable learning ground that was lost during COVID. Our teachers are working harder than they ever have and the gains made by our students are showing that the work is paying off.
We will never stop pursuing best practices for our students when it comes to education and helping them fulfill their potential. The hill is steep but we’re all climbing it together.